
What a growth chart doesn't tell you about your child
A percentile describes a population, not a person. Here's what the curve is actually for — and the half of the picture it was never designed to hold.
By Baby Kangoo Team
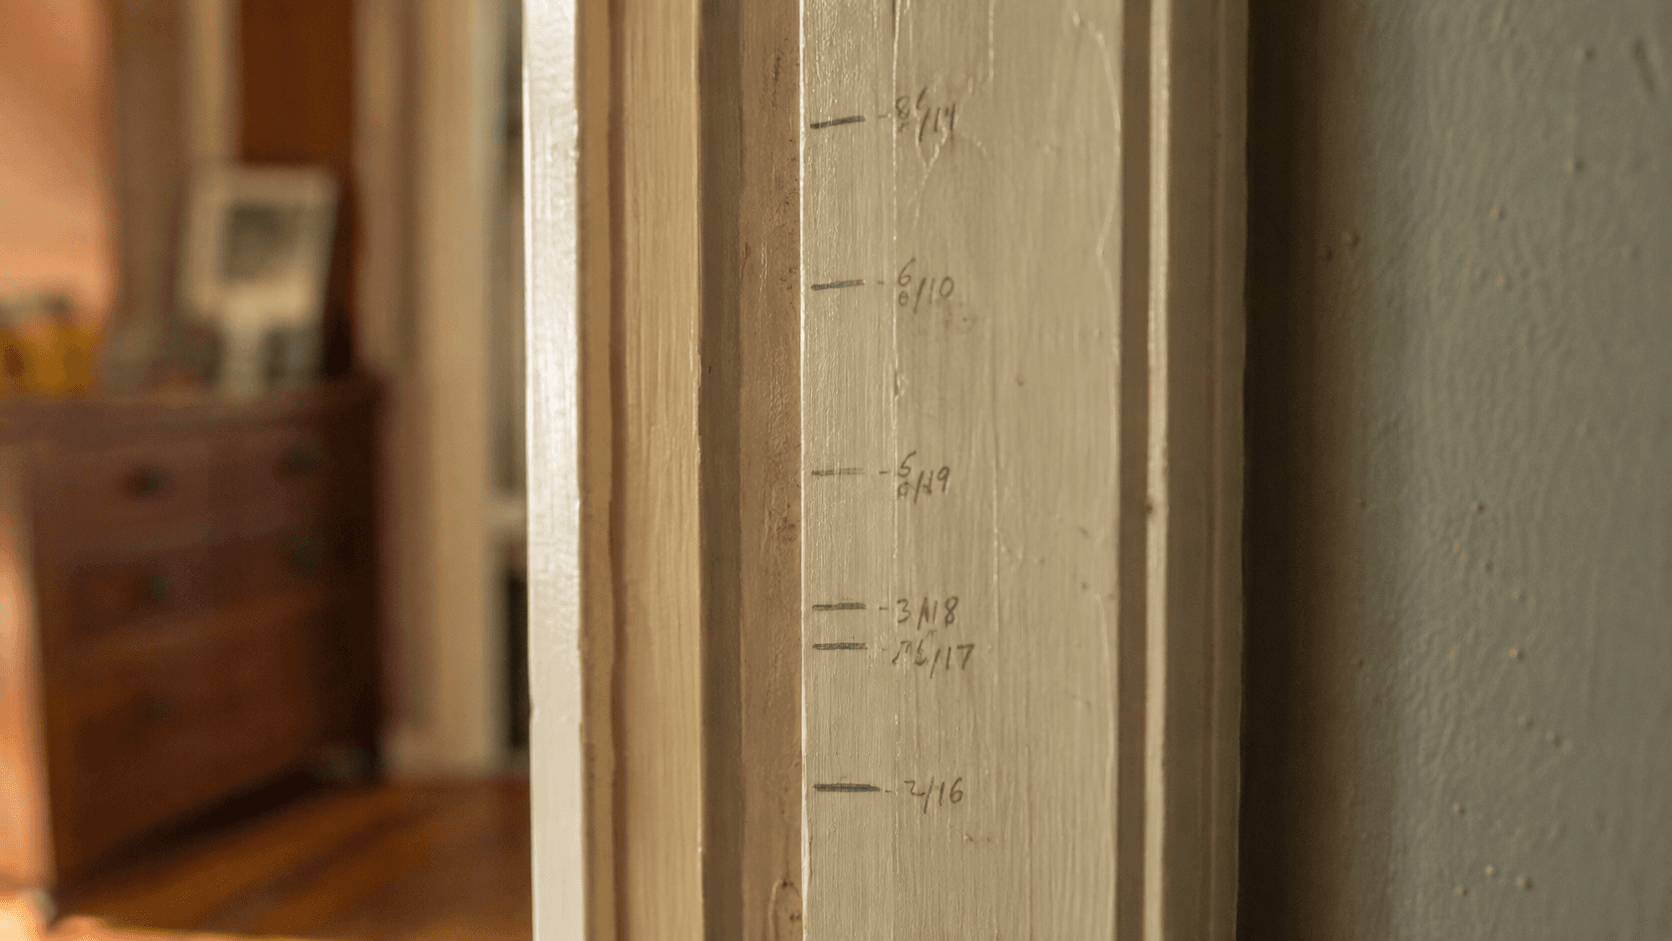
Almost every parent has walked out of an appointment holding a number they didn't entirely understand.
Not a bad number. Just a number — a percentile, a point on a curve — that arrived without much explanation and then sat in the back of the mind for weeks, quietly meaning something.
It's worth being clear about what that curve is, because the way it gets talked about between parents and the way it works are two different things.
What the chart is
A growth chart is a description of a population. It says how a large number of children of that age and sex were distributed. A percentile is a position in that distribution — and that is the entire claim it makes.
It is not a score. There is no end of the chart that is better than the other end. Half of all healthy children are, necessarily, below the middle line, because that is how a middle line works.
What clinicians are trained to read is not one point but the pattern — the shape a child's own curve makes over time, and how it fits with everything else they know about that child. That reading is theirs to do. It requires the full picture, and one number seen out of context is not the full picture.
What it was never designed to hold
Here's the part that gets lost: the chart records two measurements and nothing else. Everything that makes your child recognisably themselves is outside its scope, on purpose.
It doesn't know that they've been sleeping through since August. It doesn't know they refuse anything green, that they laugh at doors closing, that they went quiet for a fortnight in July and came out of it talking. It doesn't know what they were like the week they were unwell, or how long it took to get back to normal.
"I could tell you her percentile to one decimal place. I couldn't tell you when she stopped waking at five."
None of that is a criticism of the chart. A tool that measured all of it wouldn't be a chart. It's just worth noticing that the one number families tend to remember is, by design, the least personal thing recorded that day.
The record that sits alongside it
The most useful thing you can bring to the next appointment isn't a worry about a percentile. It's continuity — what has actually been happening between the two visits, in plain language.
- What changed with sleeping and eating, and roughly when
- Anything new you noticed, with the date you first noticed it
- Illnesses, and how long they took
- What you were told last time, so you can say whether it held
- Your own questions, in your own words
That is the half of the picture only you have. Nobody else in the room saw the last three months.
Both halves, or neither
The numbers are the part that gets written down automatically — they arrive in a file whether anyone does anything or not.
The rest only exists if someone records it. And of the two, it's the second half that turns a set of measurements into a description of an actual child. Any question about what a specific number means belongs with the person who took it; the story around it is yours to keep.